Tracer Pebble Studies
 At Coastal Partners, we have developed an innovative method of using tagged tracer pebbles to track the movement of sediment along our beaches. By deploying and tracking these pebbles, we are able to collect valuable information on rates, direction and the patterns of littoral drift within an area of interest. This helps us to better understand local coastal processes, which in turn supports local coastal management decisions, aids coastal defence scheme design and informs local beach maintenance activities, such as recycling and replenishment campaigns.
Click on the map below to be directed to the Tracer Pebble Studies page
There is growing interest in the method, with future tracer pebble deployments along the south coast of England being co-ordinated by SCG / SCOPAC, visit the website
Key Facts
- The tracers are not easily visible and are therefore less prone to disturbance from beach users
- The tracer tags use no power and can be left in the field for long periods of time
- The vertical detection range of the antenna can be up to 1m, which enables buried tracer pebbles to be identified
- After initial deployment a number of retrieval surveys are conducted over a period of weeks, months and years to allow long-term trends in sediment pathways to be identified
- Average detection rates over a two week period are approximately 72%, with more than 95% of all tags being detected more than once
- After 5 months in the field, tracers can disperse along 3 kilometres of beach
How could this method help you?
- The method confirms the local scale sediment transport pathways which directly affect the movement of material along the beach frontage;
- The results provide a powerful tool to aid Beach Management Plans and the location of beach control structures;
- Clearly presented results are a powerful tool for explaining sediment transport to council members and the general public;
- The results have already proved useful in discussions with various stakeholders around the frontage, and the study has received widespread support and interest from Councillors and the public alike.
How Do They Work?
 Small Radio Frequency Identification (RFID) tags are embedded within native pebbles collected from a site of interest and secured with a waterproof resin.
The pebbles are then deployed and re-surveyed at set intervals using a specialised scanner and a Global Positioning System (GPS). The RFID tags are passive, meaning that they have no internal power source and can remain in situ for long periods. The tag only broadcasts a unique identification number when detected with the scanner, which can be logged together with the GPS to establish an accurate position.
How Do We Survey The Beach?
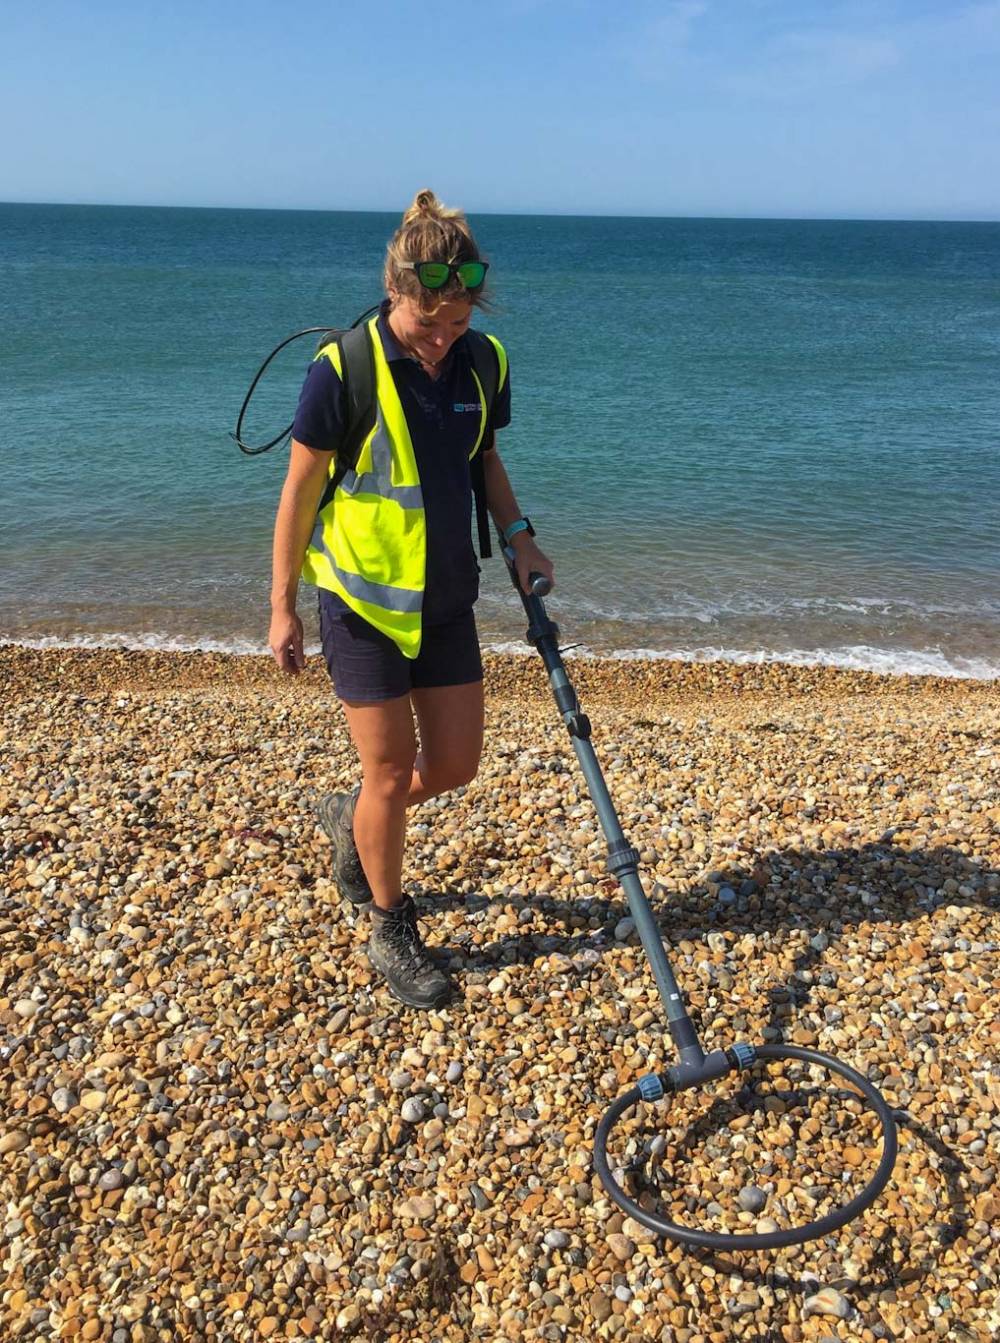 We walk the beach with the handheld antennas using one, or several surveyors, depending on the size of the beach that we need to cover. The surveyors sweep the beach in a linear pattern between mean low water spring (MLWS) and the mean high water spring (MHWS). Sometimes the back of the beach will also be surveyed if there has been a particularly strong storm event.
The equipment will make an audible noise when a tag has been detected and will automatically log the tag number together with the GPS location. This means that we do not need to stop and obtain a visual identification of the pebble.
Why Are Tracers Needed?
Data produced by the tracer pebbles has proven to be highly useful. Where elevation difference plots or aerial photography are not sufficient to identify net sediment movement following replenishment or recycling activities the data from the tracer pebbles can be used. Coastal Partners have successfully applied the method in conjunction with topographic data to understand how quickly and how far replenished material moves downdrift. The results have also helped to confirm the location of drift divides; convergence zones, net sediment drift patterns as well as identifying localised drift reversals.
The images below show an example of how tracer pebbles have been used alongside traditional beach surveying methods to aid the analysis of longshore sediment transport around Portsmouth.
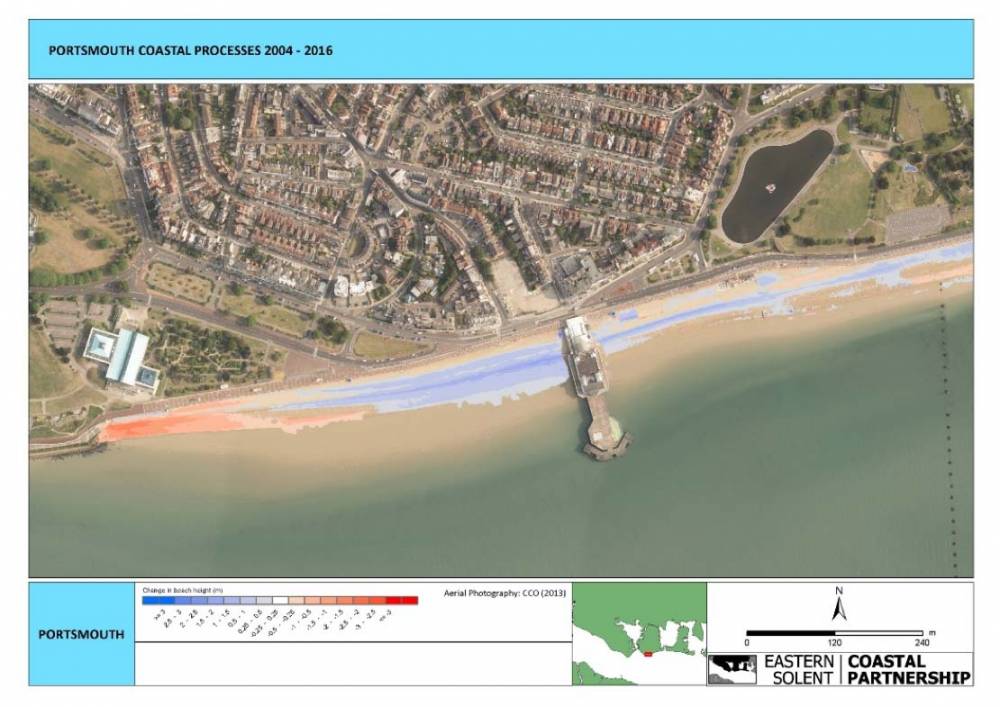 Historically, drift along this frontage was understood to be from west to east (left to right in the picture), as this direction of transport is seen along the rest of the beach frontage. A topographic difference plot showing the changes in beach levels between 2004 and 2016 indicates that erosion has occurred (shown in red) around the western end of the beach, suggesting material is lost from this end of the beach.
The figure to the right shows Topographic difference plot, showing the changes in beach levels between 2004 and 2016. The red colour shows where the beach has lowered (erosion) and the blue indicates areas that have built up (accretion).
 Using this valuable information, our engineers are able to analyse trends in beach behaviour, both long term and in response to high energy wave events. This helps us to be able to estimate where material can be recycled to and from and identify areas where material is likely to be lost.
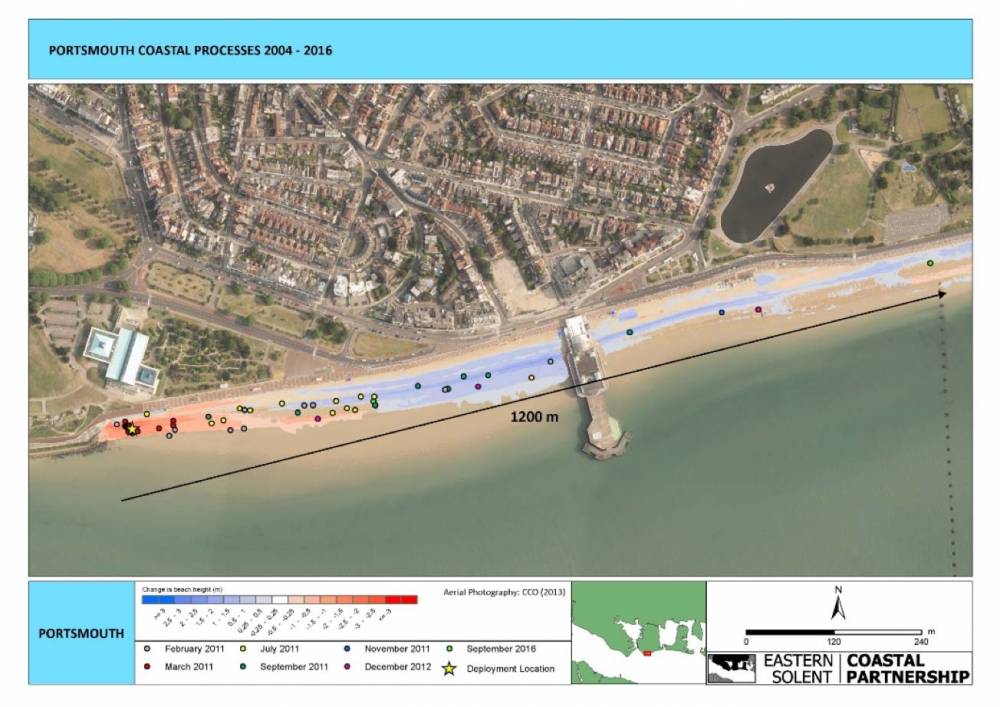
However, when results from the tracer study carried out between 2011 and 2016 are overlaid onto the same image.
See the second figure to the right.
It becomes clear that the net sediment drift direction is in fact from east to west!
Selsey, West Sussex, 2025 - 2026
Southsea Frontage West, Portsmouth, 2025 - 2026
Southsea, Portsmouth, 2026 - 2027